Predictive Analytics Strategy is giving everyday business teams the power to act smarter, faster, and more confidently.
According to MarketUS, the global predictive analytics market is projected to grow from USD 14.9 billion in 2023 to USD 108 billion by 2033, at a CAGR of 21.9%. That kind of growth means one thing, businesses are betting big on predicting what happens next.
And here’s where most non-tech teams hit a wall. It’s not easy figuring out what tools to use, what steps to follow, or who to trust as your development partner. Things can get technical, fast.
That’s why this blog exists. It’s your practical, easy-to-follow guide to building a predictive analytics strategy for non-tech teams. By the end, you’ll know what to do, what to avoid, and how to move forward, with zero confusion.
Let’s get into it.
What is a Predictive Analytics Strategy for Non-Tech Teams?
Predictive analytics strategy for non-tech teams is a step-by-step plan that helps non-technical teams use data to predict future outcomes. It turns raw business data into smart decisions, without needing deep coding or data science skills.
When you’re not from a technical background, data can feel overwhelming. But predictive analytics doesn’t have to be complicated. In simple terms, it’s a way to use your existing business data to see what’s likely to happen next. And more importantly, what to do about it.
A predictive analytics strategy gives your team a framework to:
- Set business goals clearly
- Choose the right data sources
- Use easy tools to spot patterns
- Make smart decisions based on those patterns
You don’t need to be a data scientist. You just need a plan that works for non-tech teams. This is where a custom software development partner can help you connect the dots, without the technical mess.
What does a Predictive Analytics Strategy for Non-Tech Teams include?
A well-built predictive analytics strategy for non-tech teams keeps things simple but impactful. It focuses on what your team truly needs, clarity, not complexity. Incorporating AI in Predictive Analytics enhances this simplicity by automating insights without adding technical burden. Below are the core elements that make this strategy work without overwhelming your team.
| Element | Purpose |
| Business Goal Mapping | Aligns analytics with what really matters to your team. |
| Data Source Identification | Finds where your useful data already lives. |
| Tool & Tech Selection | Picks platforms that don’t need tech-heavy skills. |
| Simple Predictive Models | Applies logic to spot trends, seasonality, or risk. |
| Visualization & Reporting | Shows insights in easy-to-read dashboards. |
| Decision Playbooks | Helps teams act on predictions confidently. |
With a strong predictive analytics strategy for non-technical teams, you make sure your team doesn’t just collect data, they use it. And use it well.
Why Non-Tech Teams Need a Predictive Analytics Strategy
Non-tech teams need a predictive analytics strategy because business decisions today move fast, and waiting for data teams can slow you down or cost you big.
Most business units already collect data daily, sales numbers, customer feedback, inventory records, campaign results, support tickets, and more. But without a clear strategy, that data sits untouched. You keep reacting, instead of preparing.
A predictive analytics strategy helps you flip that. It gives you the structure to look ahead, not just analyze the past. Aligning your efforts with emerging Predictive Analytics Trends ensures your strategy stays relevant and future-focused. When the strategy is built with non-tech teams in mind, it becomes easy to use without needing code, dashboards, or technical tools you don’t understand.
So why is this strategy a must-have now?
Today, business moves fast and expectations are higher than ever. A predictive analytics strategy helps your team stay ahead, not catch up.

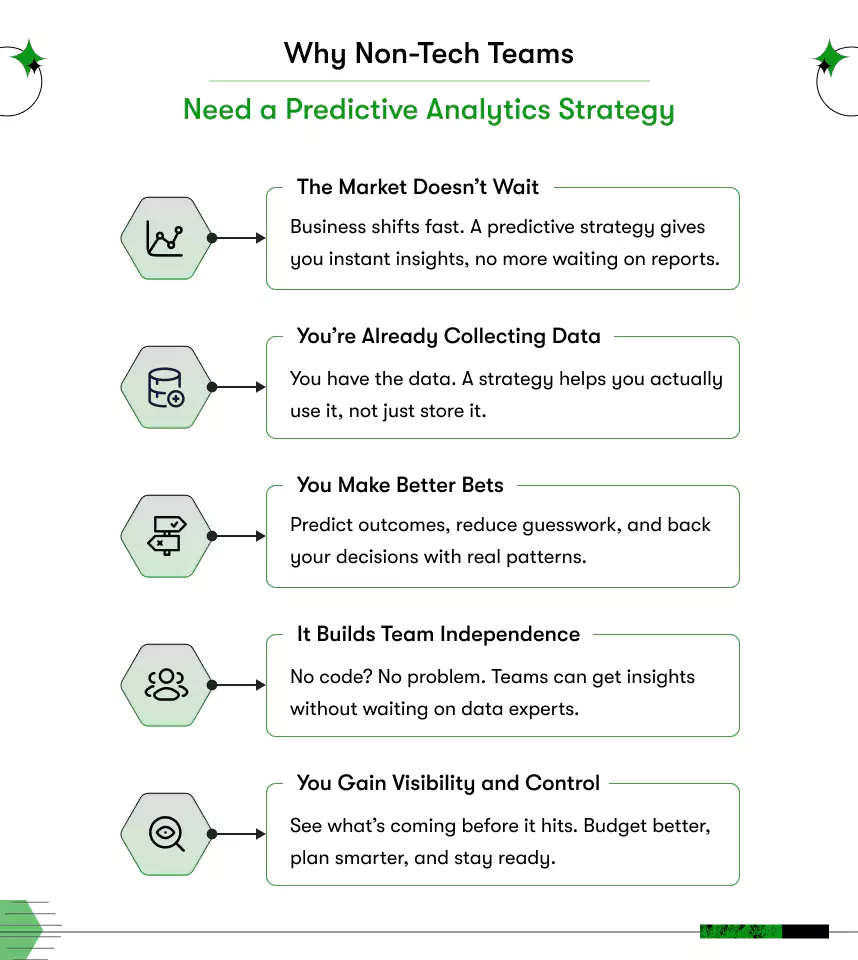
1. The market doesn’t wait
Customer expectations, pricing trends, supply issues, everything shifts fast. If your team waits weeks to get reports from analysts or IT, you’re reacting too late. A predictive analytics strategy gives you a faster line to insights, so you’re ready before things change.
2. You’re already collecting data, you just don’t use it well
Most non-tech teams already have the data they need. But it’s scattered in spreadsheets, tools, or reports no one touches. A predictive strategy organizes it, connects it, and turns it into real answers.
3. You make better bets
Whether it’s launching a new product, planning inventory, or predicting sales dips, gut feeling alone isn’t enough. A solid strategy helps you back every decision with patterns and probabilities, not just instinct.
4. It makes teams independent
You don’t always need to rely on data scientists. With the right tools and a clear strategy, your sales, marketing, ops, or HR teams can ask their own questions, and get answers.
5. You gain visibility and control
With clear reports and predictions, you don’t just get numbers. You see what’s coming. That helps you budget better, assign resources wisely, and plan for the unexpected.
A quick note on tech, without the tech-speak
You may hear terms like AI & machine learning in predictive analytics and feel like it’s out of your league. But here’s the truth: you don’t need to understand the science behind it to benefit from it.
A strong strategy puts the heavy tech in the background and keeps the focus on one thing, making better business decisions with less effort. Let the tools handle the complexity. Your job is to act on what they show you.
And if you’re still weighing predictive analytics vs traditional analytics, remember this: traditional methods look back, while predictive models help you plan ahead. In short, a predictive analytics strategy for non-tech teams gives you the power to lead with confidence, not confusion. You don’t need to become technical. You just need to be curious, open, and ready to work smarter.
How to Build a Predictive Analytics Strategy (Step-by-Step)
You don’t need a data science degree to build a working predictive analytics strategy. What you need is clarity on what you want to solve, a good set of tools, and a step-by-step approach that helps your team act before problems occur.
Let’s break it down in simple, real-life terms.

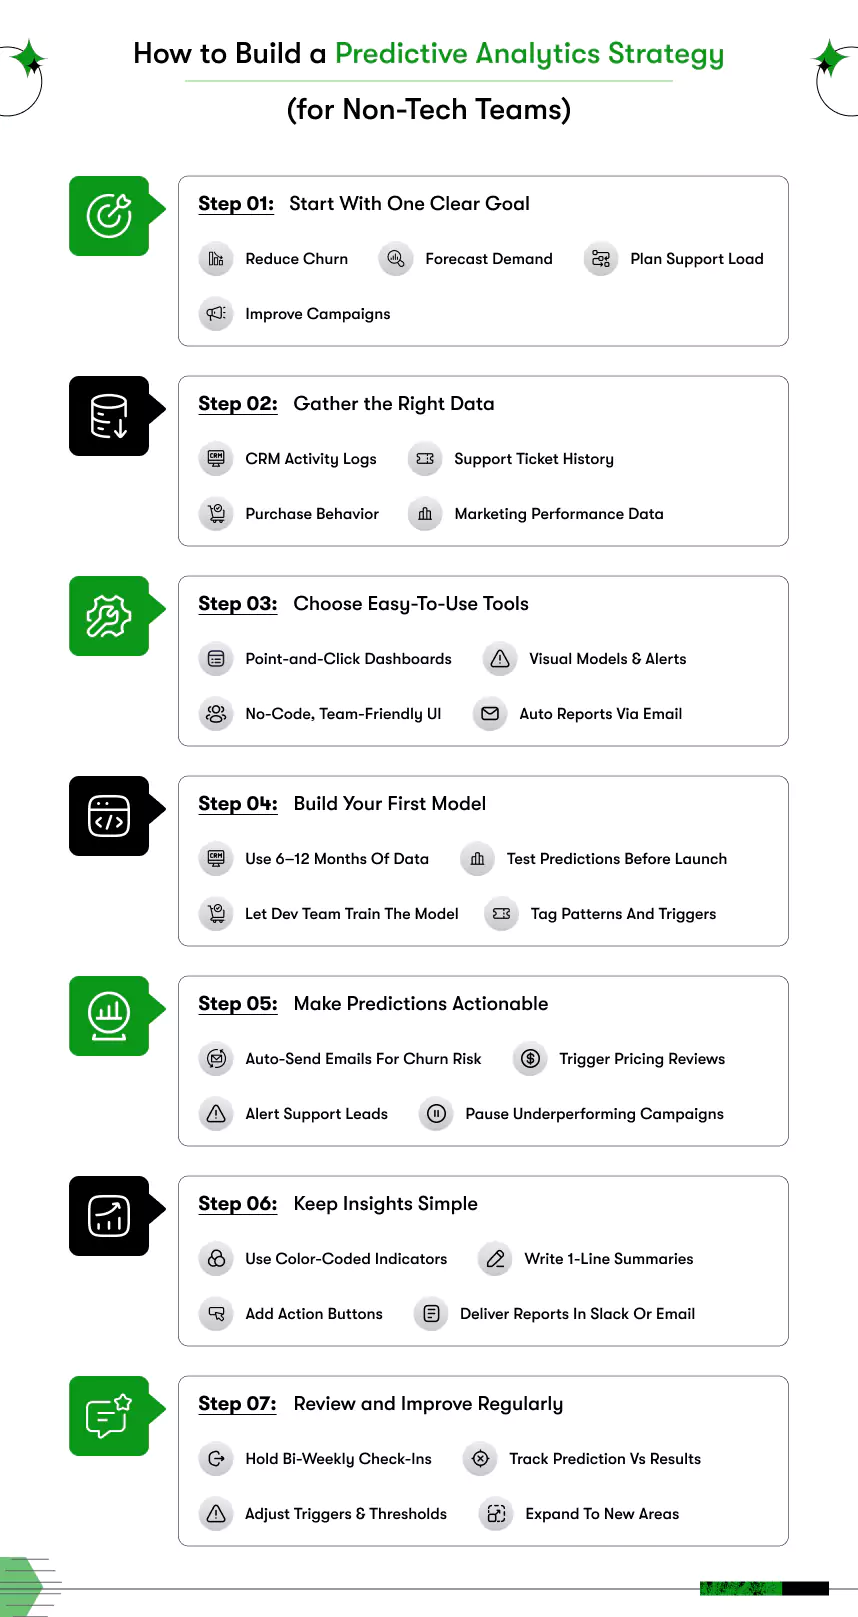
Step 1: Start with one clear business goal
This is where it all begins. If your team doesn’t have a specific problem to solve, your predictive analytics will feel like guesswork.
So pick one question that matters. Here are four common examples and how to approach them:
Reducing customer churn
Customers don’t just leave, they show signs before they go silent. Missed logins, reduced engagement, slow responses, these behaviors are your early warning system.
How to get it done:
Use your CRM data to identify customers who haven’t interacted in a while. Feed that data into a tool that can spot behavior patterns tied to previous churn cases. Then, set triggers to notify your team when those patterns appear again.
Forecasting inventory demand
Too much inventory ties up money. Too little, and you lose sales. Predicting demand helps you order smarter.
How to get it done:
Pull order history, seasonal sales trends, and delivery timelines from your inventory or sales system. Your software partner can build a simple model that finds when specific SKUs are likely to spike or drop. Your team can stock up or scale down before it becomes a problem.
Predicting peak support load
Support teams are always busy during product launches or seasonal surges. But are you preparing early?
How to get it done:
Look at the help desk or ticket volume from the last 6–12 months. Match peaks with product updates, marketing pushes, or billing cycles. Your tool can learn this pattern and give your team a heads-up before another spike hits.
Planning better marketing campaigns
You’ve run campaigns that flopped, and some that soared. But why?
How to get it done:
Track your email open rates, ad performance, and seasonal engagement trends. The system can compare this to your upcoming campaigns and predict how likely they are to work. This lets your team optimize timing, messaging, and targeting.
All these are real-world examples of how a predictive analytics strategy for non-tech teams starts, with one specific goal and a clear way to solve it.
Step 2: Gather the data you already have
You don’t need to collect new data to begin. You simply need to gather the right data that supports your goal. For example, if the goal is reducing customer churn, here is how to identify what to look for:
How to get it done (explained practically):
Where do we track customer activity?
Check your CRM system. Tools like HubSpot, Zoho, or Salesforce often log login frequency, last purchase, or time spent on the platform. If that data is missing, ask your software partner to help integrate those touchpoints.
Do we log support interactions or complaints?
Review your helpdesk or chat system, such as Freshdesk, Zendesk, or Intercom. Export past tickets related to churned customers. These logs help identify warning signs that lead to dissatisfaction.
Can we see when a customer last purchased or logged in?
This data is usually stored in billing software like Stripe or Razorpay, or backend user logs. If it’s not being captured, request your development partner to implement basic user tracking going forward.
You are not expected to analyze or clean this data. Your responsibility is to identify what matters and where it is stored. From there, your software team takes over.
Step 3: Choose tools your team will actually use
Choosing the right platform is key. If the tool is too technical, your team will avoid using it. The right predictive tool must simplify decisions, not complicate them.
How to get it done (explained practically):
Point-and-click dashboards
These allow you to create reports by dragging filters or choosing options, not writing code. For example, a sales manager can drag a date range to filter Q1 performance in Power BI.
Automation features
Enable the platform to send weekly email reports like “Top 5 Products With Declining Sales.” These summaries keep everyone aligned without needing to log in daily.
Visual models
Tools should present predictions as clear graphs or charts. For example, a spike in support tickets before churn should be shown visually, making it easier to act.
Built-in explanations
Platforms should explain the “why” behind predictions in plain language. A good system might say, “Sales are projected to drop due to a decline in repeat visitors.”
Request a sandbox trial
Ask your development team to let real users from your business try the platform before rollout. If a non-tech team member can use it confidently, it’s the right tool.
Step 4: Build your first prediction model
This step connects your data to outcomes. A prediction model simply finds patterns in historical data and uses them to anticipate future behavior.
How to get it done (explained practically):
Export 6 to 12 months of support ticket data
Ask your support team to export logs from platforms like Zendesk or Freshdesk. These should include timestamps and resolution categories.
Tag events tied to spikes
Review when ticket volumes were unusually high. Tag these periods with reasons, such as “new feature release” or “website downtime.”
Let your development team build the model
They will train the system using the historical data to recognize similar spike patterns.
Test and validate
Ask your partner to simulate upcoming weeks using the model. If it correctly predicts a support spike based on similar triggers, you’re ready to go live.
This is how you understand how predictive analytics works in a non-technical way. It is not a guess. It is making informed forecasts based on the past.
Step 5: Make sure every prediction has a next step
A prediction is only helpful if it leads to a decision. Your predictive analytics system should not just flag an issue; it should also guide what to do about it.
How to get it done (explained practically):
If churn risk crosses 70 percent, auto-send a re-engagement email
Set up an email workflow in your CRM to reach out with an offer, survey, or follow-up from the account manager.
If demand drops below average for three days, trigger a pricing review
Notify the product or sales manager. Use a shared document or form to evaluate product pricing or bundling strategies.
If projected ticket volume is high, notify the support lead
Send alerts through Slack or email to plan staff allocation or set up automated replies.
If campaign ROI drops, pause and A/B test a new version
Integrate your prediction platform with Meta Ads or Google Ads to automatically adjust creative elements based on the alert.
These if-then actions can be embedded into your dashboards and systems with the help of your software team.
Step 6: Keep your insights simple and visible
Data is only valuable when it can be understood by the team. If a dashboard is too detailed or too complex, it won’t be used consistently. Your reports must show the issue, explain the cause, and guide the next step.
How to get it done (explained practically):
Use visual indicators
Add colored highlights like red for risks, yellow for caution, and green for all-clear. These should appear alongside key metrics and charts.
Write one-line summaries
Below each graph or trend, add a summary like “Customer drop-off increasing due to low email open rates this week.”
Embed actions within the report
Include links or buttons that let the team respond. For example, a button to schedule follow-ups or access an email template.
Distribute insights in existing tools
Send reports to the team in Slack, Microsoft Teams, or directly through email. Do not force them to log in to a separate dashboard every time.
The easier it is to understand, the faster your team can act.
Step 7: Review and improve your strategy often
Your predictive analytics strategy should not be set and forgotten. Real results come when you continuously learn from what worked and refine what didn’t.
How to get it done (explained practically):
Hold bi-weekly review meetings
Invite stakeholders to share what insights were acted upon, which ones were ignored, and what outcomes followed.
Compare predictions with actual outcomes
Keep a log that tracks how accurate the model was. For example, did predicted churn actually result in cancellation? Was the inventory spike handled correctly?
Update thresholds and triggers
If 70 percent churn risk is too late, try 60 percent. If support alerts come too early, delay them. Adjust based on feedback.
Expand into new areas
Once one model is working, look into others. Start predicting upsells, customer satisfaction, or product returns.
This is where your team starts seeing the true ROI of predictive analytics. You are not just reacting, you are anticipating, adjusting, and leading with confidence.
Reviewing and refining your predictive analytics strategy turns it into a long-term advantage. By adjusting thresholds, learning from outcomes, and adding new goals, your team builds a smarter system that keeps improving with time.
Common Predictive Analytics Strategy Mistakes Non-Tech Teams Must Avoid
A predictive analytics strategy for non-tech teams can transform how your business makes decisions. But like any process, it comes with risks if not handled carefully. For many non-technical teams, the problem isn’t a lack of tools; it’s misunderstanding how to use them, what to focus on, or how to stay aligned with business goals.
Let’s break down the most common mistakes and how to avoid them before they create roadblocks.
Mistake 1: Skipping the business goal
Many teams dive straight into data or tools without identifying the core problem they want to solve. That makes everything from tool selection to implementation directionless.
How to avoid it:
- Start with one clear, outcome-driven goal.
- For example: reducing churn, predicting inventory gaps, or preventing delivery delays.
- Keep everything, including data, tools, and actions, aligned with that goal.
Mistake 2: Collecting too much data without focus
Non-tech teams sometimes believe more data leads to better insights. But in reality, excess data without relevance creates noise and overwhelms the system.
How to avoid it:
- Focus on the data directly tied to your goal.
- If you’re forecasting demand, look at historical sales, seasonal shifts, and delivery timelines, not general website traffic.
- Work with your software partner to prepare clean, usable datasets.
Mistake 3: Using tools the team doesn’t understand
Complex dashboards, confusing metrics, or overly technical tools can stop your team from using the system at all.
How to avoid it:
- Choose tools built for business users, not data experts.
- Look for platforms with simple interfaces, plain-language summaries, and no-code configurations.
- Always test the tools with your actual team before you finalize.
Mistake 4: Ignoring feedback from real outcomes
Once the model is live, it’s easy to assume it will stay accurate forever. But without checking the results, you won’t know if the predictions are useful.
How to avoid it:
- Create a basic feedback loop after every major prediction.
- For example: if the model predicted churn, did that customer actually leave?
- Use that input to adjust your thresholds, alerts, or logic as needed.
This is one of the most overlooked predictive analytics challenges, especially for non-tech teams who treat the system as a one-time setup. Continuous learning makes the system better over time.
Mistake 5: Not connecting predictions to actions
A report showing risks or trends means little if your team doesn’t know what to do with it.
How to avoid it:
- Link every alert or insight to a defined action.
- For example: if churn risk is flagged, notify account managers with a follow-up template.
- Build playbooks that turn every prediction into a next step.


Mistake 6: Trying to solve too much at once
Some teams want to predict everything, sales, churn, returns, staffing needs, all in the first launch. That often leads to confusion and failure to launch.
How to avoid it:
- Start with one focused use case.
- Solve that fully, then expand to other goals over time.
- This builds team confidence and ensures higher adoption.
Avoiding these common mistakes ensures your predictive analytics strategy stays clear, focused, and results-driven. It’s not about doing everything perfectly. It’s about making data work for your team in a way they can understand, trust, and act on.
How to Choose the Right Software Partner for Your Predictive Analytics Strategy
The right software development partner will do more than build features. They will help your team think ahead, act faster, and get results that grow over time. That’s what separates a tool from a true predictive analytics solution. You need a partner who can understand your goals, simplify complexity, and align the system to your team’s capabilities.
If you’re unsure where to start, this predictive analytics guide will help you choose the right custom software development company to bring your predictive analytics to life.

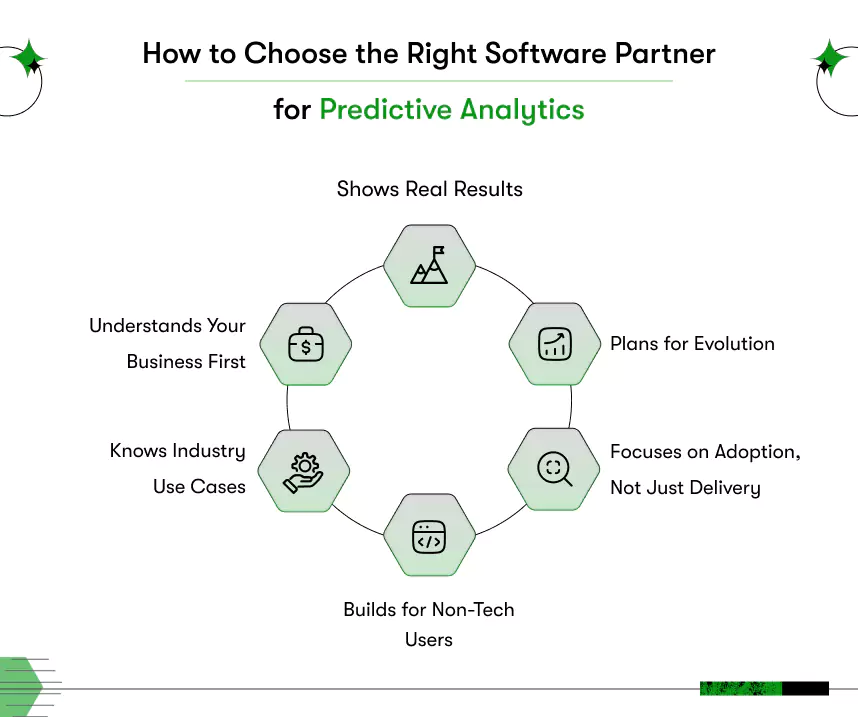
1. Does the development team understand your business model, not just your data?
A software team that asks for your database without asking about your revenue model, customer journey, or delivery challenges is not the right team.
What to do:
- Walk them through your most painful business bottleneck
- Ask them what kind of data they would need to solve it
- If they talk about business logic before tools, you’re on the right track
This step separates partners who build for business outcomes from those who just plug in software.
2. Can the development partner identify real-world predictive use cases?
Many vendors focus on tools and algorithms, but what matters more is their understanding of your industry. A partner with relevant experience will not just build software, they’ll help you make better decisions.
Ask these questions:
- Have they worked with companies in your space before?
- Do they understand the predictive analytics use cases relevant to your industry?
- Can they talk about how analytics supports outcomes, not just how the technology works?
The right partner will guide you through strategy and help you apply insights, even if you don’t speak the technical language.
3. Will the system be usable by non-technical teams?
If your staff can’t understand or use the dashboard without asking for help, it will eventually be ignored, no matter how smart the system is.
How to evaluate this:
- Ask the software development company how they simplify the tools for non-technical users.
- Request a demo or a case study showing how previous clients interacted with the system.
- Ask what type of onboarding or training is included post-launch.
A solid partner will always align the solution to match a predictive analytics strategy for non-technical business users.
4. Does the vendor build for adoption, not just delivery?
Many software vendors hand over the system and move on. But predictive analytics only works when the tool becomes part of how the business operates.
How to evaluate this:
- Ask if the vendor will help build workflows tied to predictions, such as email alerts or action triggers.
- Ask whether they offer post-launch support to refine the model based on team feedback.
- Find out if they help automate the action plan, not just the insight.
If the partner doesn’t plan beyond the dashboard, adoption will fall flat.
5. Will the partner adapt the strategy over time?
A predictive system that’s right today might be outdated in six months. Customer behavior, sales cycles, and market trends shift, so your partner must build for evolution.
How to evaluate this:
- Ask how often the development company reviews prediction accuracy.
- Ask how they adjust thresholds, variables, and alerts as business data changes.
- See if they monitor and apply emerging predictive analytics trends to your system over time.
The right partner builds a system that evolves with you, not one that gets outdated fast.
6. Can the software partner show proof of success?
A qualified development company should be able to walk you through real projects they’ve delivered, especially those for non-tech teams or in your industry.
What to ask for:
- Case studies or live examples from similar businesses
- Before-and-after insights on how predictive analytics improved decision-making
- Proof that the system was usable and valuable to a non-technical team
Great software partners don’t just talk, they show.
The success of your predictive analytics strategy depends on the software development partner you trust to build it. You don’t just need technical execution. You need a long-term team who understands your business, supports your people, and guides you from strategy to results.
What Are Real-Life Examples of a Predictive Analytics Strategy?
A real-life example of predictive analytics is when companies use past customer behavior to forecast future actions. Businesses like Starbucks, Netflix, and Amazon use a predictive analytics strategy to guide decisions their non-tech teams act on every day.
Let’s look at how predictive analytics works in real business settings
These examples show that predictive analytics isn’t just for data scientists. When built well, it becomes a powerful tool that even non-technical teams can use to drive real outcomes.
Starbucks – Predicting Store Success Before Opening
Business Problem: Where should we open the next store to ensure high performance?
How they used predictive analytics:
- Starbucks analyzes data like foot traffic, population density, income levels, and nearby competitors.
- Their real estate and planning teams (non-technical roles) use this data in user-friendly dashboards.
- The system scores potential locations and highlights the best-fit areas for store success.
Impact:
Better location decisions, increased store profitability, and more consistent customer traffic.
Netflix – Forecasting Content Engagement Before Release
Business Problem: What type of shows or thumbnails should we promote to different users?
How they used predictive analytics:
- Netflix tracks viewer history, behavior patterns, and content ratings.
- Marketing and content teams (non-technical) access visual reports that show likely engagement per audience segment.
- These predictions guide campaign timing, trailer formats, and even show thumbnails.
Impact:
Increased watch time, better content discovery, and reduced customer churn.
Amazon – Predicting Demand and Delivery Efficiency
Business Problem: How can we stock the right products in the right warehouses before orders come in?
How they used predictive analytics:
- Amazon uses purchasing history, location trends, and delivery data to forecast demand.
- Warehouse and logistics teams (non-technical) use these predictions to decide stock movement and placement.
- Dashboards show what to prepare for and when, without complex interfaces.
Impact:
Faster delivery, reduced returns, better inventory planning
Target – Predicting Shopping Life Events Before They Happen
Business Problem: How can we personalize promotions based on life changes?
How they used predictive analytics:
- Target analyzed customer shopping behavior to predict life events like pregnancy.
- Marketing teams used these signals to trigger specific coupon campaigns for baby products.
- The system operated in the background while retail and marketing teams focused on delivery.
Impact:
Better targeting, increased loyalty, higher conversion rates.
These examples show how a strong predictive analytics strategy for non-tech teams is not only possible but proven. Each company used data they already had, paired it with a focused goal, and let their non-technical teams take action.
You don’t need a massive tech team to do this. You need:
- A clear business question.
- Data that connects to that question.
- A software partner who knows how to build around your workflow.
That’s how predictive analytics becomes more than just a system, it becomes a competitive advantage your whole team can use with confidence.
What is the Most Used Technique in Predictive Analytics?
The most commonly used technique in predictive analytics is regression analysis. It’s simple, widely applicable, and ideal for teams starting out, especially non-tech teams.
What is regression analysis?
- A method that identifies relationships between different variables in your data.
- It shows how one factor (like ad spend) affects another (like revenue or customer signups).
- It builds a formula based on past data to predict future outcomes.
Why businesses use regression analysis:
- Easy to understand – even non-technical teams can interpret the results through dashboards and charts
- Flexible – works with both small and large datasets.
- Applicable across industries – retail, healthcare, logistics, finance, and more.
- Gives explainable predictions – helps you understand “why” something might happen, not just “what” might happen.
Real-world example:
- A retail brand wants to predict next month’s sales.
- They feed in past data like marketing budget, number of website visitors, and historical sales.
- Regression analysis shows which factors have the strongest impact on sales.
- The model then predicts future performance based on those variables.
Regression analysis is often the first step in any predictive analytics strategy. It gives businesses a low-barrier, high-impact way to move from guessing to forecasting without needing a full team of data scientists.
Conclusion: Make Predictive Analytics Work for Your Team
Predictive analytics doesn’t have to be complicated. With the right strategy and the support of expert predictive analytics consulting, even non-technical teams can make faster, smarter decisions that directly impact revenue, customer retention, and operational efficiency.
You now know what to avoid, what steps to follow, and how real businesses are already using data to move ahead.
If you’re ready to turn your data into real business outcomes, Kody Technolab Ltd. is here to help. We specialize in predictive analytics consulting and build custom strategy solutions tailored for non-tech teams to maximize Predictive Analytics ROI.
From defining your goal to building user-friendly dashboards and automating actions, we make it simple, usable, and scalable.
Let’s build a solution your team can trust, understand, and use every day. Get in touch with Kody Technolab today to start your journey with predictive analytics, confidently.