Key Takeaways
- People analytics for retail is transforming physical stores into data-driven environments, enabling real-time visibility into shopper behavior and conversion performance.
- Traditional retail analytics methods fail to capture in-store behavior, leaving critical gaps in understanding why up to 70% of visitors don’t convert.
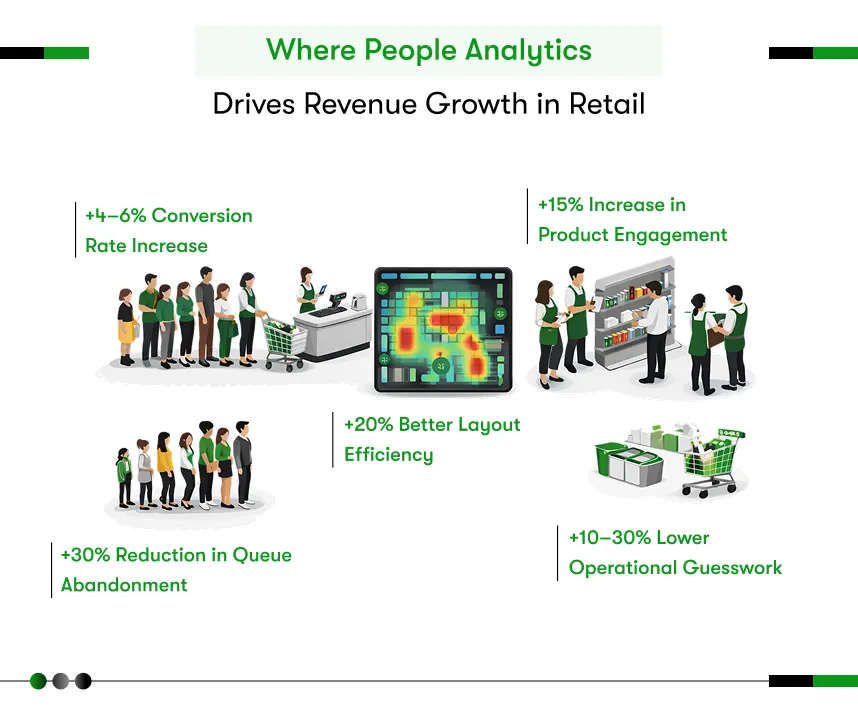
- Retailers using people analytics for retail and computer vision report up to 20% higher conversion rates by optimizing layouts, staffing, and product placement.
- Queue analytics alone addresses a major revenue leak, with 86% of shoppers abandoning purchases due to long wait times, making it one of the fastest ROI use cases.
- Even small gains matter: a 2–3% increase in conversion rate through people analytics for retail can translate into significant incremental revenue without increasing footfall.
- AI-powered in-store analytics delivers 3–5% sales lift and 20–30% reduction in operational costs, improving both top-line and bottom-line performance.
- The future of retail lies in real-time, always-on intelligence where decisions around layout, staffing, and merchandising are driven by behavioral data, not assumptions.
- Retailers that adopt people analytics early gain a measurable competitive advantage, while those who delay risk ongoing revenue loss due to lack of in-store visibility.
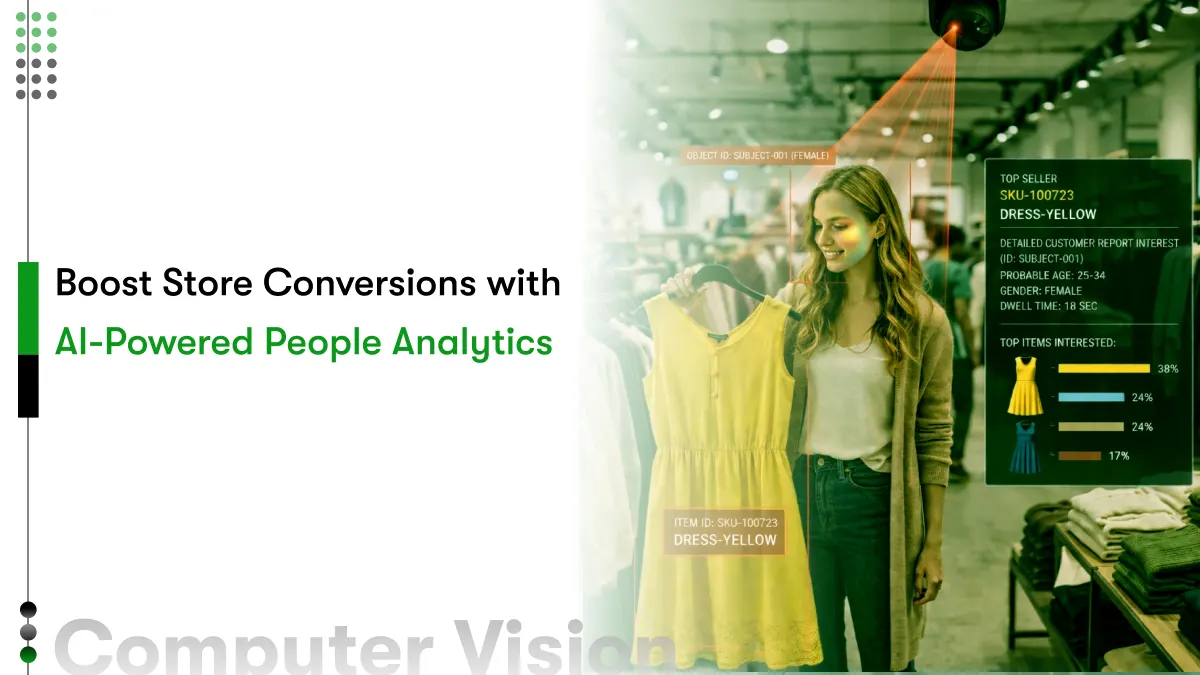
People analytics for retail is no longer optional. It is essential for turning browsers into buyers. Your store sees hundreds of daily visitors, yet most leave empty-handed. Why? You can’t track where they linger, what draws their gaze, or what sends them away without purchasing. This visibility gap erodes revenue fast.
McKinsey reports retailers using in-store analytics with computer vision achieve up to 20% higher conversions by decoding shopper behavior precisely. Computer vision for retail eliminates guesswork, revealing dwell times, paths, and queue analytics for retail bottlenecks.
This guide delivers a step-by-step blueprint to deploy it, optimize layouts, slash abandonment, and boost your bottom line, and an ROI framework for C-suite decision makers.
What is People Analytics for Retail?
People analytics for retail is the practice of collecting and analyzing shopper behavior data inside a physical store. It tracks how customers move, where they stop, how long they stay, and whether they buy.
Think of it this way. Your e-commerce team knows everything. They see where every visitor clicks, how long each page holds attention, and exactly where people drop off. They use that data to fix the funnel and improve conversions daily.
Your physical store? It has been flying blind for decades.
Retail people analytics changes that. It gives your physical store the same data intelligence your website already has. Here is what it measures:
- Footfall: how many people enter your store, at what time, and on which days
- Dwell time: how long shoppers spend in each zone or near each product
- Path mapping: the exact routes customers take through your store
- Queue analytics retail (Queue behavior): how long people wait at checkout and how many leave because of it
- Conversion events: the ratio of browsers to buyers in every section of your store
To understand the technology that makes this data collection possible, see how does computer vision works.
Why People Analytics for Retail is Now a Conversion Priority?
People analytics for retail is now a conversion priority because the cost of guessing is too high. Retailers lose an estimated $1.75 trillion globally to out-of-stocks, overstocks, and poor customer experience every year.
Here is the real problem your store is likely facing right now.
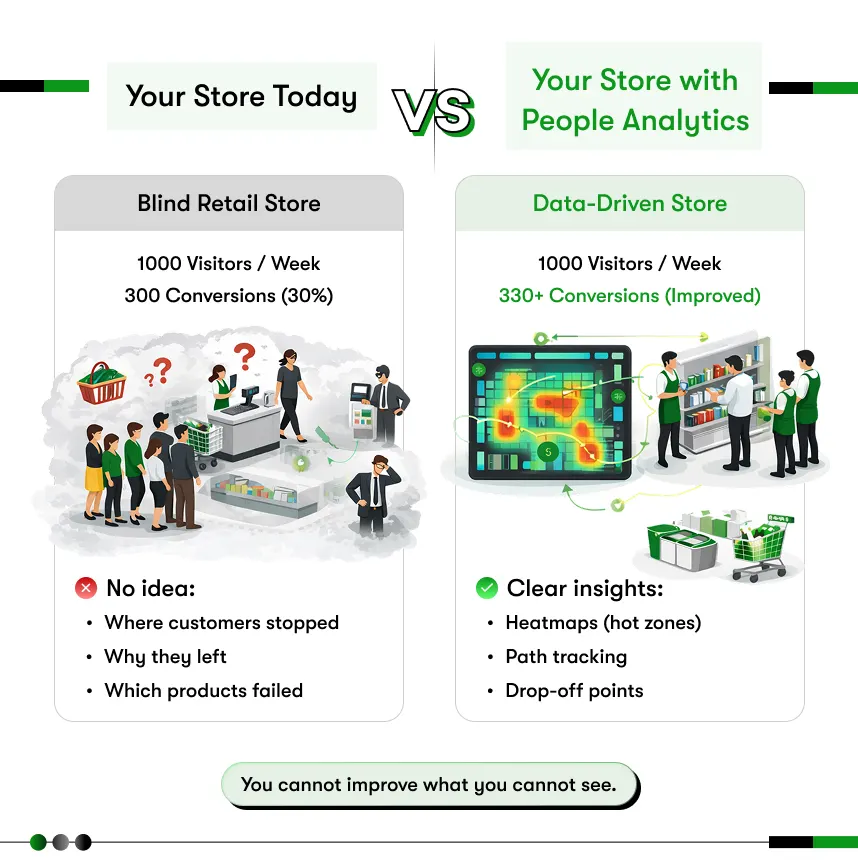
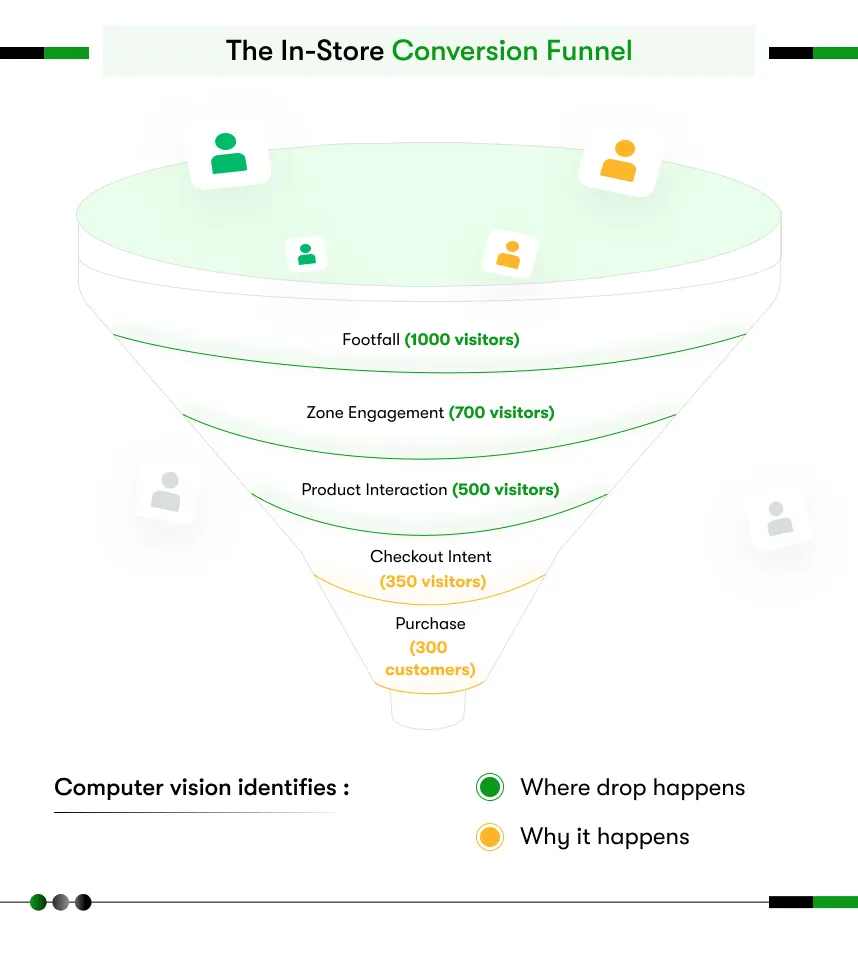
You get 1,000 visitors per week. You convert 300. That is a 30% conversion rate. You have no idea why 700 people left without buying. Was it a long queue? A confusing layout? A product they could not find? Staff who were not where they needed to be? Without data, every decision is a guess, and guessing in retail costs you money.
Why Traditional Methods Fall Short
Manual people counting tells you how many entered. It tells you nothing about what they did inside. Basic CCTV records footage nobody watches. Exit surveys capture only the customers willing to stop and answer questions, which is rarely more than 5% of shoppers.
Manual counters, basic CCTV, and exit surveys track entry volume only. The traditional tools miss shopper behavior like dwell time and paths where conversions happen.
Why 2026 is the Inflection Point
Three things have converged to make retail AI analytics deployable at scale right now. First, AI models are accurate enough to deliver reliable commercial insights. Second, camera hardware costs have dropped by over 60% in five years. Third, edge computing means you process data locally, with no cloud latency and no privacy exposure.
The global computer vision AI retail market was valued at $1.66 billion in 2024. It is projected to reach $12.56 billion by 2033 (Grand View Research, 2024). Your competitors across the world are already moving. The window to gain a first-mover advantage in your market is closing.
How to Power In-Store Analytics with Computer Vision
In-store analytics with computer vision works by turning your existing cameras into intelligent sensors. The cameras capture video. The AI analyses every frame in real time. The system converts raw footage into structured business data.
Here is the data pipeline in plain terms.
- Camera captures: overhead or fixed cameras record movement across all zones
- AI processes: the computer vision model detects people, tracks paths, and measures dwell time
- System filters: staff are separated from customers, so your conversion data stays accurate
- Dashboard delivers: store managers see live and historical insights on one screen
- Action triggers: alerts fire automatically when queues hit a threshold or a zone goes cold
The system runs in two modes. Real-time analytics lets your team act on what is happening now, opening a new till when a queue builds or moving a staff member to a high-traffic zone. Aggregated analytics show you trends over days, weeks, and months so you can make better layout, staffing, and product placement decisions.
Critically, the system processes all data anonymously. No faces are stored, no personal data is retained, and the output is behavioral patterns, not individual profiles. So, anonymous data processing keeps your deployment compliant with GDPR, CCPA, and UAE PDPL regulations.
For a deeper look at how retailers are applying this technology today, see the computer vision in retail guide.
Key Use Cases: Where People Analytics in Retail Drives Conversions
People analytics in retail drives conversions by turning shopper behavior into specific, actionable decisions across six high-impact areas.
Each use case below addresses a real conversion leak in your store. Read them as a checklist, and if any of the use cases sound familiar, your store has untapped conversion potential.
Footfall and Zone Traffic Analysis
You know how many people enter, but do you know which zones they visit and which zones they skip entirely? Footfall analysis with computer vision maps traffic density across every section of your store, identifying hot zones where engagement is high and cold zones where products sit unnoticed.
Kroger used zone traffic data to redesign key store sections; as a result, there was 12% increase in conversion rates in targeted areas. The change was not a product change or geographical change; it was a strategic layout change, which was guided entirely by people’s data with the help of people analytics for retail.
Customer Journey and Path Mapping
Most stores are designed based on assumptions about how customers move, and path mapping shows you the reality. It reveals which entrances funnel customers toward high-margin sections and which layouts create dead-end routes that push shoppers toward the exit.
When you know the most traveled paths, you can position your best-margin products directly in them. You stop hoping customers find your promotions and start making sure they do.
Queue Analytics for Retail: Reducing Checkout Abandonment
Queue analytics for retail is one of the highest ROI applications in this entire retail space. Here is why, in the USA, 86% of consumers have left a store because of a long queue. That translates to an estimated $38 billion in lost sales annually.
Computer vision monitors queue length and wait time in real time. When the queue hits a pre-set threshold, the system alerts staff to open additional tills. So, the insight helps you stop abandonment before customers get frustrated and leave. Queue analytics retail is a powerful tool that turns real-time data into immediate action so stores can keep lines moving, improve customer satisfaction, and protect revenue.
Display and Product Engagement Tracking
A customer stops in front of a display for 45 seconds, the customer looks but does not pick anything up, and walks away. That is a signal, either the pricing is wrong, the product is confusing, or the placement is poor. Without computer vision, you never see that signal; you are just left with an assumption.
Dwell time data combined with sales data tells you exactly which displays convert browsers into buyers and which ones attract attention but fail to close. One of the practical examples is Sephora and Nike, both of which use AI vision analytics to measure display engagement and optimize product placement accordingly.
Staff Placement and Floor Optimization
Staff availability accounts for 5.5% of all in-store negative feedback (HappyOrNot Retail CX Insights, 2025). Customers who cannot find help do not wait for long; they simply leave without making any purchase.
People analytics in retail shows you peak traffic times by zone, so you can deploy your team where shoppers actually are, not where managers assumed they would be. Flannels used this data to improve staffing allocation by 34% and boost store conversion by 0.75% across all 50 UK locations. Imagine the difference people analytics in retail can make for your store.
Conversion Funnel Visibility
The conversion funnel visibility is the big picture view. Computer vision for retail conversion optimization shows you the full in-store funnel: how many people entered, how many browsed specific sections, how many reached the checkout, and how many completed a purchase.
When you can see each step of that funnel, you can identify exactly where you are losing people and fix it with precision. This is the same discipline e-commerce teams have practiced for years. Now your physical store can do the same and benefit.
For a wider view of how these applications compare across industries, explore computer vision examples.
How to Increase Store Conversions Using Computer Vision
You increase store conversions using computer vision by turning people analytics data into specific operational decisions. Data alone changes nothing. The decisions you make with it change everything.
Here is how to increase store conversion using computer vision for your retail business:
Optimize Store Layout Using Heatmap Data
Your heatmap shows a high-traffic corridor on the left side of your store. Your best-margin products sit on the right, where 60% of customers never go. Move the products. It costs nothing. It changes the conversion math immediately.
Retailers using heatmap-guided layout changes report unplanned purchase increases of up to 15% when high-margin items are repositioned into natural traffic flows (Voxel51, 2025).
Reduce Queue Abandonment With Real-Time Staffing Alerts
Set a queue threshold of four people. When the system detects that number at any till, it sends an alert to your floor manager’s device. A second till opens within 90 seconds. The queue clears. The customer stays.
One multi-unit operator reduced payroll hours by 12% and improved conversion rate by 6 points using queue data and AI-guided staffing recommendations (ReBiz, 2025). Fewer staff hours. Higher conversions. The data made both possible.
Improve Product Placement Using Dwell and Engagement Data
A product with high dwell time but low conversion is telling you something. Shoppers are interested but not buying. That is a pricing, labeling, or packaging problem. You can test a fix immediately and measure the conversion change within days.
A product with low dwell time and low conversion is a placement problem. Move it to a zone with higher traffic and test again. People analytics gives you the feedback loop to iterate fast.
Use Shopper Behavior Patterns to Personalize In-Store Experience
When you know that shoppers in your electronics section spend an average of 8 minutes but only convert at 22%, you can test a simple fix: deploy a trained staff member to that zone during peak hours to assist undecided browsers.
Virgin Media O2 used this exact approach with Aura Vision’s people analytics platform. The result was a 22x return on investment by optimizing handset display engagement across 307 retail locations (Aura Vision, 2024).
For a full breakdown of the tools that power these workflows, explore computer vision tools in detail.
Retail AI Analytics: What the Numbers Say
Retail AI analytics delivers measurable commercial results. These are not projections. These are outcomes from live retail deployments.
The data makes the case:
- Retailers using verified AI metrics report an average conversion rate increase of 4.29 points and a 51% gross profit increase (ReBiz, 2025)
- AI-powered staff placement improved conversion reporting accuracy by 24% at one major UK retailer (Aura Vision, 2024)
- Adidas UAE converted existing CCTV into a people analytics engine and achieved a 9x return on investment (Aura Vision, 2024)
- Decathlon achieved a 0.5% conversion uplift and 6x ROI from a single people analytics use case within weeks of deployment (Aura Vision, 2024)
- Stores deploying AI video analytics report a 3 to 5% sales lift and 20 to 30% reduction in manual labor costs for inventory and floor monitoring (AIMonk, 2025)
- 63% of retailers now consider AI analytics essential for maintaining competitive advantage (Everseen, 2025)
The pattern is consistent across geographies and store formats. The retailers seeing the strongest results are not the ones with the biggest technology budgets. They are the ones who started with a clear use case, deployed a focused pilot, and scaled from proven results.
Your Implementation Options: How to Get Started with Kody Technolab
Once you decide to build a people analytics capability for your retail operation, the next question is how. Three paths exist. The right one depends on your team’s internal capability and your timeline.
Work with a Computer Vision Software Development Company
A computer vision software development company builds your analytics platform from the ground up. The development team handles model training, camera integration, data pipeline architecture, and dashboard delivery. You get a custom system built specifically for your store formats, your product categories, and your conversion goals.
Kody Technolab is a deep-tech custom AI automation software development company. Kody builds retail analytics platforms that integrate with your existing camera infrastructure and deliver actionable shopper behavior data from day one. No rip-and-replace. No lengthy hardware procurement. Just smart software on top of what you already have.
This is the right route when:
- Your store has unique formats that off-the-shelf tools cannot accommodate
- You need full ownership of the data and the system architecture
- You want a partner who understands both retail operations and deep tech AI development
Ready to explore what a custom build looks like for your business? Talk to Kody Technolab today.
Hire Computer Vision Developers
If you want to build and own an internal AI analytics capability, you hire computer vision developers to join your team. They build the models, maintain the pipelines, and evolve the system as your store network grows.
Core roles you will need:
- Computer vision engineers for model development and training
- MLOps engineers to manage deployment and retraining pipelines
- Data engineers to connect camera feeds, POS data, and analytics dashboards
- Retail domain experts to validate model outputs against real store behavior
Kody Technolab also provides augmented team models. Kody’s engineers embed with your internal team and transfer the knowledge your developers need to own the system long-term. This reduces dependency on external vendors without sacrificing development speed.
For a realistic cost breakdown before you budget, see the computer vision software development cost guide.
Is Retail AI Analytics Worth the Investment?
Yes. But the more honest answer is: the question is not whether it is worth the investment. The question is what it is costing you to not have it.
The Cost of Not Having People Analytics
Every week your store operates without people analytics is a week you are making layout, staffing, and merchandising decisions based on gut feel. Some of those decisions will be right. Many will not. And you will never know the difference.
Here is a simple calculation for a C-Suite decision maker. If your store converts at 30% and people analytics helps you reach 33%, that is a 10% revenue increase from the same foot traffic, with no additional marketing spend.
For a store doing $5 million annually, that 3-point conversion improvement is worth $500,000 in incremental revenue per year. A well-scoped people analytics deployment across a mid-size retail network typically costs a fraction of that to build and maintain.
ROI Framework for C-Suite Decision Makers
When building the internal business case, anchor it to numbers your CFO already cares about.
- What is your current store conversion rate, and what is the revenue impact of each percentage point?
- How much revenue do you estimate you lose to queue abandonment per month?
- What is the loaded cost of your current manual people-counting and floor observation processes?
- How much of your layout and merchandising spend is currently based on data versus assumption?
A focused pilot on one store or one zone typically delivers enough data to answer all four questions and build a compelling case for full rollout within 60 to 90 days. Decathlon did exactly this and achieved 6x ROI before committing to a wider deployment.
For a complete technical reference on how the underlying technology is built, the computer vision development guide is the place to start.
Are You Ready to Address the Problem?
Your store has a conversion problem, and you probably know it. Now you have a clear picture of exactly how people analytics for retail solves it. The technology is proven, and the ROI is documented. The only variable left is how quickly you move. In case you are still confused about where to implement computer vision or people analytics in retail, you can contact Kody Technolab experts for a consultation.
Kody Technolab builds custom AI-powered solutions for various industries, including retail, for businesses around the globe. From a focused pilot on a single store to a full-scale rollout across your entire network, Kody’s deep tech team delivers the system, the data, and the results. If you are ready to stop guessing and start converting, talk to Kody Technolab today.

Frequently Asked Questions
What is people analytics in retail?
People analytics in retail is the collection and analysis of shopper behavior data inside physical stores. It measures footfall, dwell time, customer paths, queue length, and conversion rates using AI-powered computer vision systems.
Unlike traditional people counters that only measure volume, retail people analytics captures behavior. It tells you not just how many people entered your store, but what each shopper did, where they went, what they engaged with, and why they did or did not buy. This data gives retail managers and C-Suite leaders the same conversion intelligence that e-commerce teams have used for years, applied to the physical store environment.
How does computer vision increase store conversions?
Computer vision increases store conversions by identifying exactly where and why shoppers stop engaging before they buy, then giving your team the data to fix those gaps.
Computer vision for retail conversion optimization works across multiple levers simultaneously: it reduces queue abandonment by triggering real-time staffing alerts, improves product placement by mapping which zones convert and which do not, and optimizes staff deployment by showing where customer engagement is highest. Each of these changes, made with precision data rather than guesswork, compounds into measurable conversion improvement across the store.
What is queue analytics in retail?
Queue analytics in retail is the use of computer vision to monitor checkout queue length and wait times in real time, triggering staff alerts when queues reach abandonment risk thresholds.
Queue analytics retail connects directly to your biggest conversion leak at the final stage of the purchase journey. A customer who has selected a product and walked to the checkout is at the highest intent point in their visit. Losing that customer to a long queue is the most expensive kind of abandonment in retail. Queue analytics prevents it by giving your operations team a live view of checkout pressure and the ability to act before a customer decides to leave.
How much does a retail people analytics system cost?
A retail people analytics system built on computer vision typically costs between $30,000 and $250,000, depending on store count, use case complexity, and whether you use existing camera infrastructure or deploy new hardware.
A single-store pilot focused on footfall and queue analytics sits at the lower end of that range and typically delivers measurable ROI within 60 to 90 days. A full custom platform built for a multi-location retail network with path mapping, zone analytics, staff optimization, and POS data integration is a more significant investment, but the revenue impact scales accordingly. The computer vision software development cost guide provides a detailed breakdown by deployment type.
What is retail AI analytics?
Retail AI analytics is the application of artificial intelligence to analyze in-store operational and shopper behavior data, converting raw camera and sensor feeds into actionable business intelligence.
Retail AI analytics covers a wide range of applications, from people counting and path analysis to product engagement tracking, queue management, and staff optimization. What distinguishes AI-powered analytics from basic reporting tools is the ability to process high volumes of unstructured visual data in real time, identify patterns that human observers would miss, and deliver insights specific enough to drive immediate operational decisions. This is the difference between knowing you have a conversion problem and knowing exactly where in your store it lives and what to do about it.


 Contact Information